I am running several Raspberry Pi’s for a host of different activities from monitoring an APC UPS to running a standard desktop and as such wanted a way to kee an eye on the status of all of them. Monitoring Raspberry Pi’s using Home Assistant is a great way of making good use of Home Assistant. Having setup Home Assistant on a Home Assistant Green which I have to say is a very good piece of hardware to be recommended and makes for a very easy and reliable Home Assistant setup I decided to see if this platform could be leveraged for this purpose. It came as no surprise that it could and there was a rather nice add-on available to do the job via HACS (the Home Assistant Community Store) from ironsheep.
Installing RPi-Reporter-MQTT2HA-Daemon on the Raspberry Pi
First off we need to install the RPi-Reporter-MQTT2HA-Daemon
Make sure your Raspberry Pi is connected to your network. Log in to your Raspberry Pi and install the packages required by the scripts
sudo apt-get install git python3 python3-pip python3-tzlocal python3-sdnotify python3-colorama python3-unidecode python3-apt python3-paho-mqtt python3-requestsNext install the scripts. This will install them into /opt/RPi-Reporter-MQTT2HA-Daemon
# Get a copy of the repository
sudo git clone https://github.com/ironsheep/RPi-Reporter-MQTT2HA-Daemon.git /opt/RPi-Reporter-MQTT2HA-Daemon

# move into your new local repository
cd /opt/RPi-Reporter-MQTT2HA-Daemon

# (NEW) Move to the latest official release:
sudo git checkout v1.8.5 # (you want to replace v1.8.5 with the latest if this isn't)

# Make sure any script requirement are installed (if they aren't aready)
sudo pip3 install -r requirements.txt
Now we need to copy and edit the default config file
sudo cp /opt/RPi-Reporter-MQTT2HA-Daemon/config.{ini.dist,ini}
sudo nano /opt/RPi-Reporter-MQTT2HA-Daemon/config.ini
You will need to edit this file to match your own configuration. Changes I made for my configuration are highlighted below:
# Configuration file for RPi-Reporter-MQTT2HA-Daemon
# Source: https://github.com/ironsheep/RPi-Reporter-MQTT2HA-Daemon
#
# Uncomment and adapt all settings as needed.
# Some settings can be configured by environment variables.
# If an env variable is set, it takes precedence over settings in this file

[Daemon]

# Enable or Disable an endless execution loop (Default: true)
#enabled = true

# This script reports RPi values at a fixed interval in minutes [2-30], [Default: 5]
#interval_in_minutes = 5

# This script checks for pending os updates at a fixed internal in hours [2-24], [Default: 4]
#check_updates_in_hours = 4

# default domain to use when hostname -f doesn't return a proper fqdn
#fallback_domain = home

[Commands]
#shutdown = /usr/bin/sudo /sbin/shutdown -h now 'shutdown rqst via MQTT'
#reboot = /usr/bin/sudo /sbin/shutdown -r now 'reboot rqst via MQTT'
#restart_service = /usr/bin/sudo systemctl restart isp-rpi-reporter.service

[MQTT]

# The hostname or IP address of the MQTT broker to connect to (Default: localhost)
# Also read from the MQTT_HOSTNAME environment variable
hostname = homeassistant

# The TCP port the MQTT broker is listening on (Default: 1883)
# Also read from the MQTT_PORT environment variable
port = 1883

# Maximum period in seconds between ping messages to the broker. (Default: 60)
keepalive = 60

# by default Home Assistant listens to the /homeassistant but it can be changed for a given installation
#  likewise, by default this script advertises on the same default topic. If you use a different
#  discovery prefix then specify yours here.  [default: homeassistant]
discovery_prefix = homeassistant

# NOTE: The MQTT topic used for this device is constructed as:
#  {base_topic}/{sensor_name}
#
# The MQTT base topic under which to publish the Raspberry Pi sensor data topi>
base_topic = home/nodes

# The MQTT name for this Raspberry Pi as a sensor
sensor_name = rpi-pidesktop


# The MQTT broker authentification credentials (Default: no authentication)
# Will also read from MQTT_USERNAME and MQTT_PASSWORD environment variables
username = <insert your MQTT broker password here>
password = <insert your MQTT broker password here>

# Enable TLS/SSL on the connection
#tls = false

# Path to CA Certificate file to verify host
#tls_ca_cert =

# Path to TLS client auth key file
#tls_keyfile =

# Path to TLS client auth certificate file
#tls_certfile =
Now run the following to test you have setup everything correctly
python3 /opt/RPi-Reporter-MQTT2HA-Daemon/ISP-RPi-mqtt-daemon.pyYou should see something similar to this if all is running properly
[2024-07-24 13:57:58] * NOTIFY: * MQTT connection established
[2024-07-24 13:57:58]
[2024-07-24 13:57:58] * NOTIFY: MQTT subscripton to home/nodes/command/rpi-pidesktop/+ disabled
[2024-07-24 13:57:59] Announcing RPi Monitoring device to MQTT broker for auto-discovery ...
[2024-07-24 13:58:00] Publishing to MQTT topic "home/nodes/sensor/rpi-pidesktop/monitor, Data:{"info": {"timestamp": "2024-07-24T13:57:59+01:00", "rpi_model": "RPi 5 Model B r1.0", ...........
Setup daemon account to allow access to temperatures
# list current groups
groups daemon
$ daemon : daemon

# add video if not present
sudo usermod daemon -a -G video

# list current groups
groups daemon
$ daemon : daemon video
#                 ^^^^^ now it is present
All my Raspberry Pi’s are running on later than jessie so therefore I run the script as a systemd service. If you are running jessie or earlier then refer back to ironsheep’s instructions to run as a Sys V init script.
sudo ln -s /opt/RPi-Reporter-MQTT2HA-Daemon/isp-rpi-reporter.service /etc/systemd/system/isp-rpi-reporter.service

sudo systemctl daemon-reload

# tell system that it can start our script at system startup during boot
sudo systemctl enable isp-rpi-reporter.service

# start the script running
sudo systemctl start isp-rpi-reporter.service

# check to make sure all is ok with the start up
sudo systemctl status isp-rpi-reporter.service
Now we can update the scripts to the latest version
# go to local repo
cd /opt/RPi-Reporter-MQTT2HA-Daemon

# stop the service
sudo systemctl stop isp-rpi-reporter.service

# get the latest version
sudo git pull

# (NEW) Move to the latest official release:
sudo git checkout v1.8.5 # (you want to replace v1.8.5 with the latest if this isn't)

# reload the systemd configuration (in case it changed)
sudo systemctl daemon-reload

# restart the service with your new version
sudo systemctl start isp-rpi-reporter.service

# if you want, check status of the running script
systemctl status isp-rpi-reporter.service
Installing the Lovelace RPi Monitoring Card on Home Assistant
For the second part of this project we now need to install the Lovelace RPi Monitoring Card on Home Assistant and configure it to display the data from our Raspberry Pi
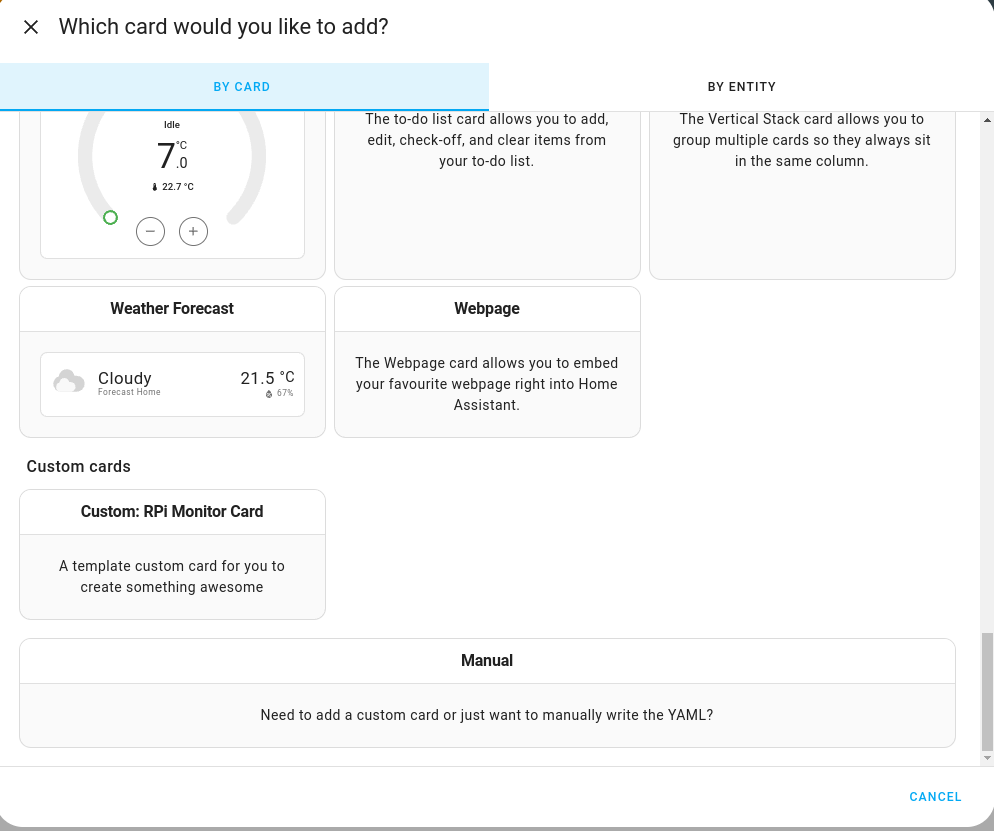
Create your new page and add the new card to the page
Then configure your card edit your card and you should see
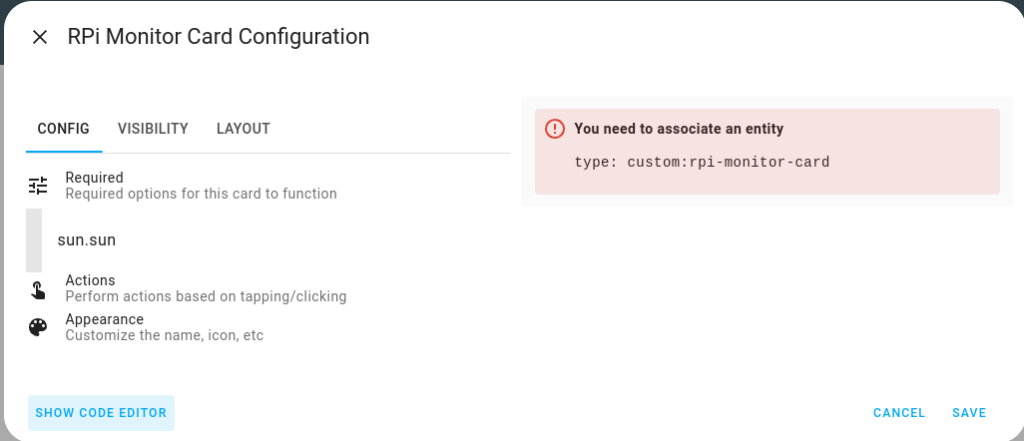
We need to switch to the code editor and add the following code
type: custom:rpi-monitor-card
entity: sensor.rpi_pidesktop_rpi_monitor_pidesktop
card_style: glance
temp_scale: c
name: Desktop
To give us
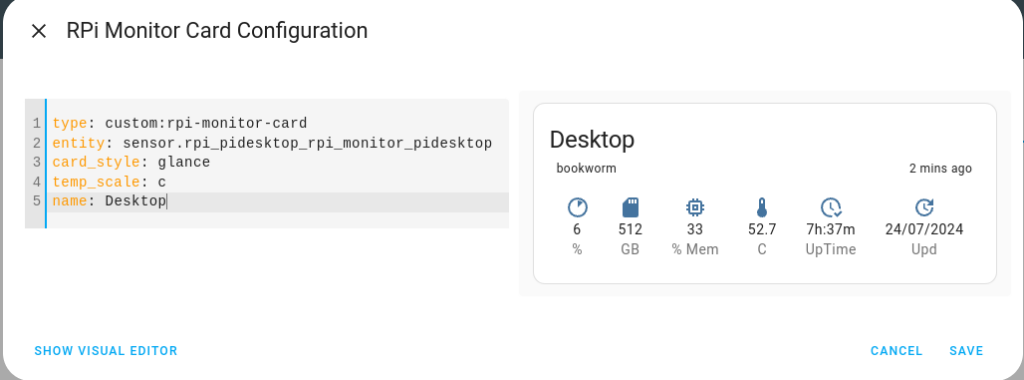
You will need to set the entity to point to the entity based on the name you gave to it in your Raspberry Pi config.ini file. I also chose to use the glance card style and set the units to degrees centigrade. Then I renamed the card to something more user friendly!
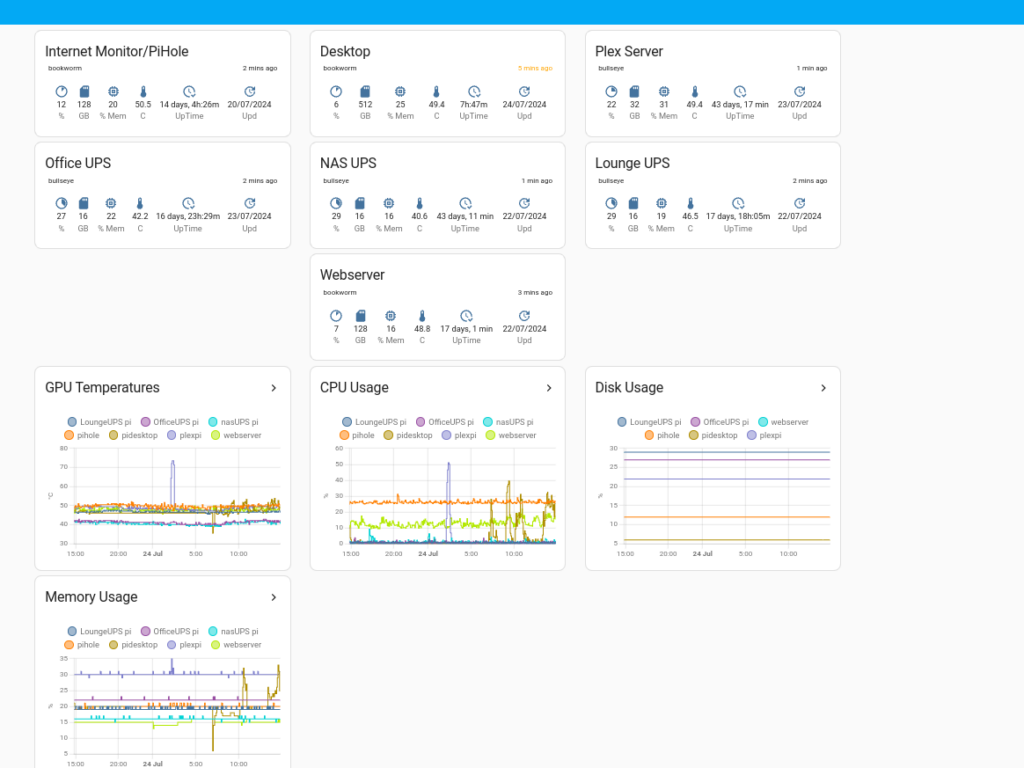
Finally I completed my monitoring screen top add all my Raspberry Pi’s and added some graphs to keep a track of key information that interested me. Namely temperatures and resource usages